Dashboard
The dashboard is a control center where you can control both your VisualOps activity and your IaaS account activity and resources within a workspace.
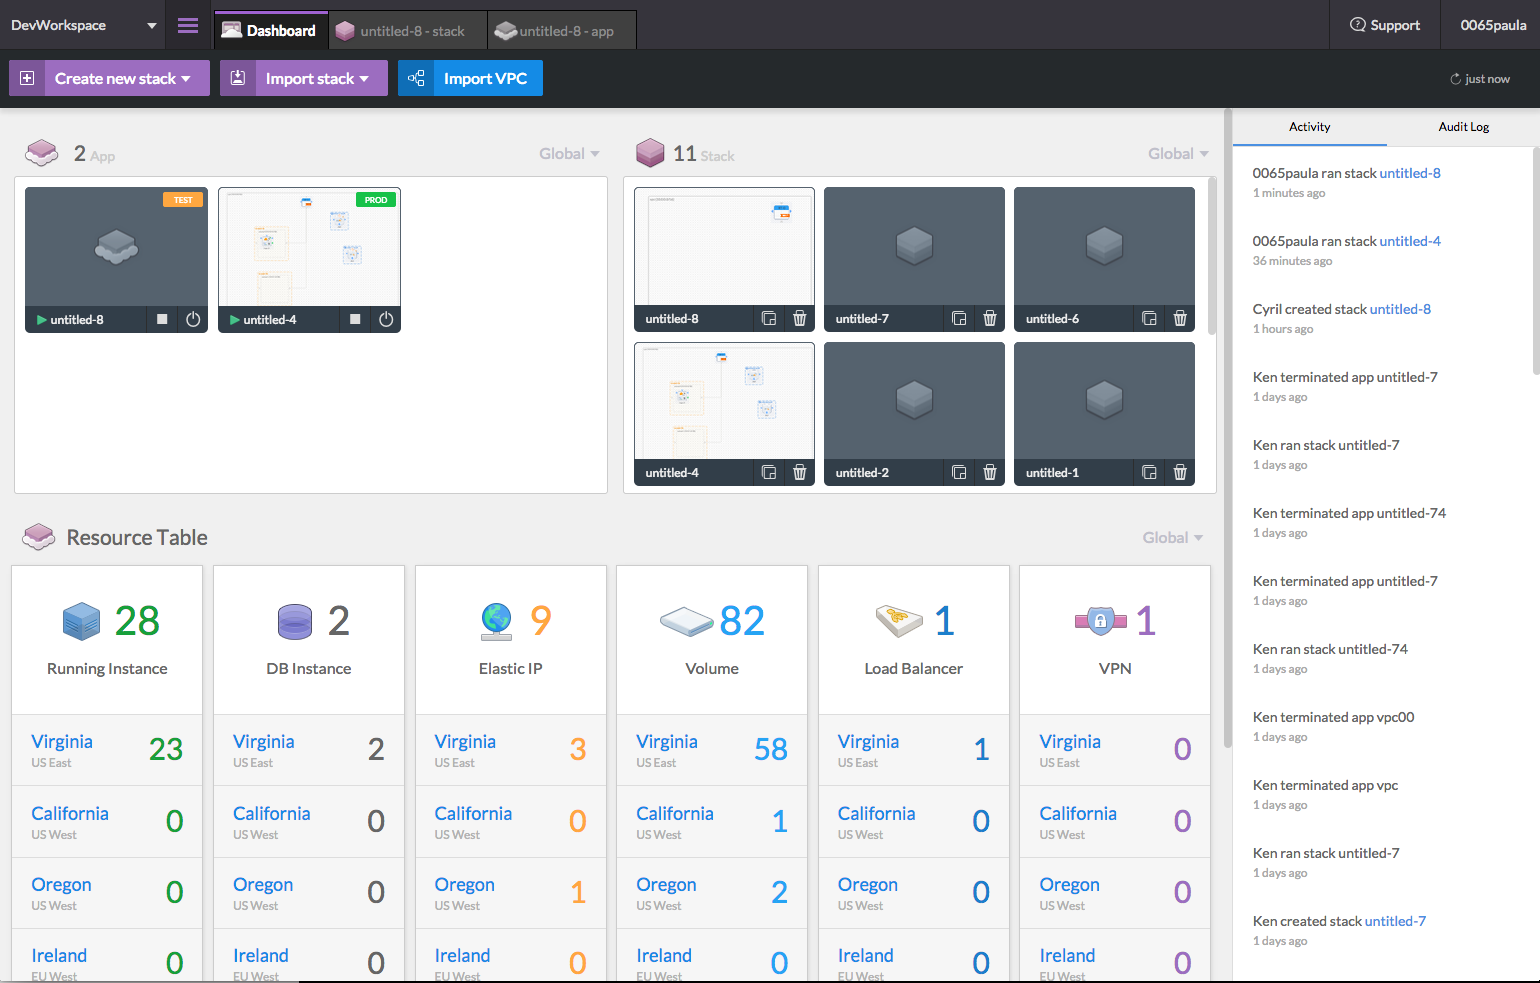
NOTE : The data displayed in the dashboard is workspace-specific. By switching to another workspace, the display will refresh to show the stack, app and cloud resources associated with the new workspace.
Stack creation button
A 'Create new Stack' button has been implemented to help you create new Stacks with VisualOps IDE. You can find it at the top left of the dashboard
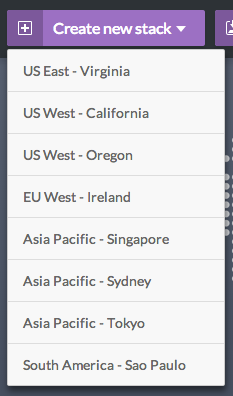
Import stack button
The 'Import stack' button allows you to import previously created stacks to the IDE
Import VPC
The 'Import VPC' button helps you to import your existing VPCs as app into VisualOps.

App/Stack View
The 'App/Stack View' is the top view of the dashboard, showing apps and stacks within current worksapce. By default it will show apps/stacks in all regions. You may switch to specific region by using the dropdown in upper corner of each section.

Resource Table
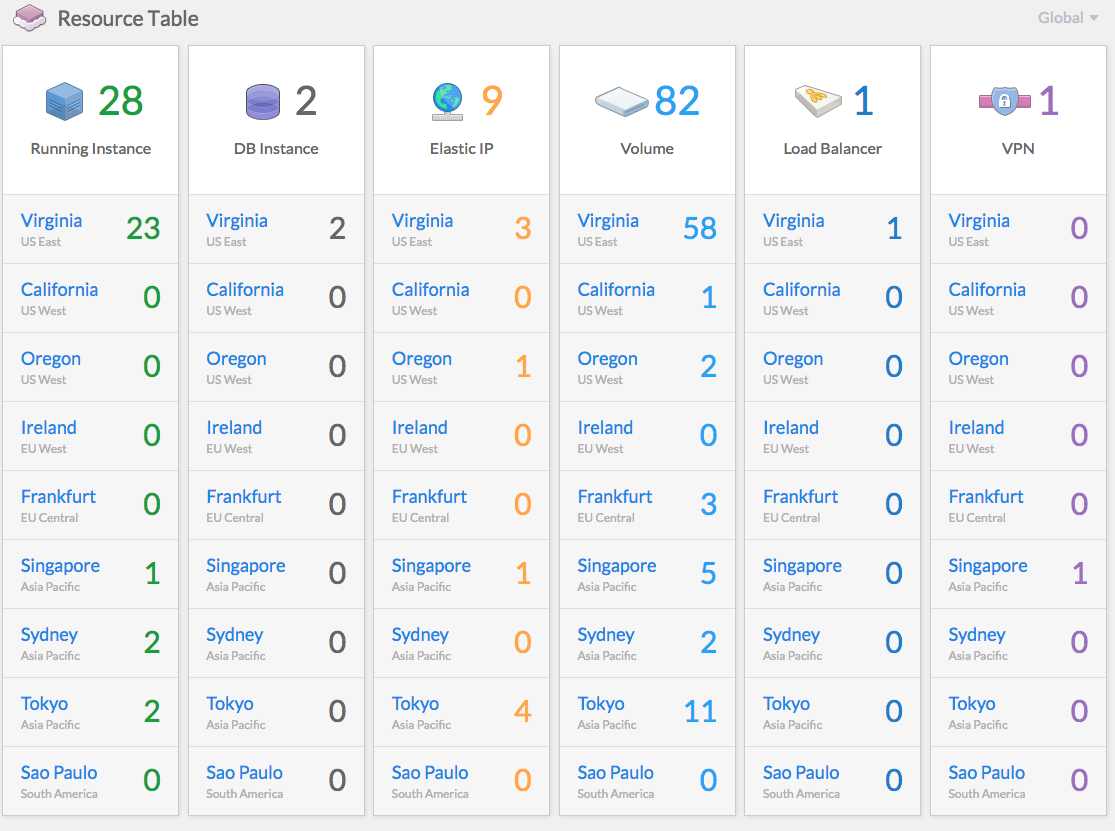
The resource table contains 2 views: global view and region view.
The global view is an overview of the costly cloud resources in all AWS regions
This view helps to quickly determine which resources are currently in use and will generate cost
As you can see above:
note #1: VPCs are inexpensive, however VPN connections to VPCs are more costly
note #2: EIP are free if associated to any instance. If this instance is stopped, your EIP will generate cost
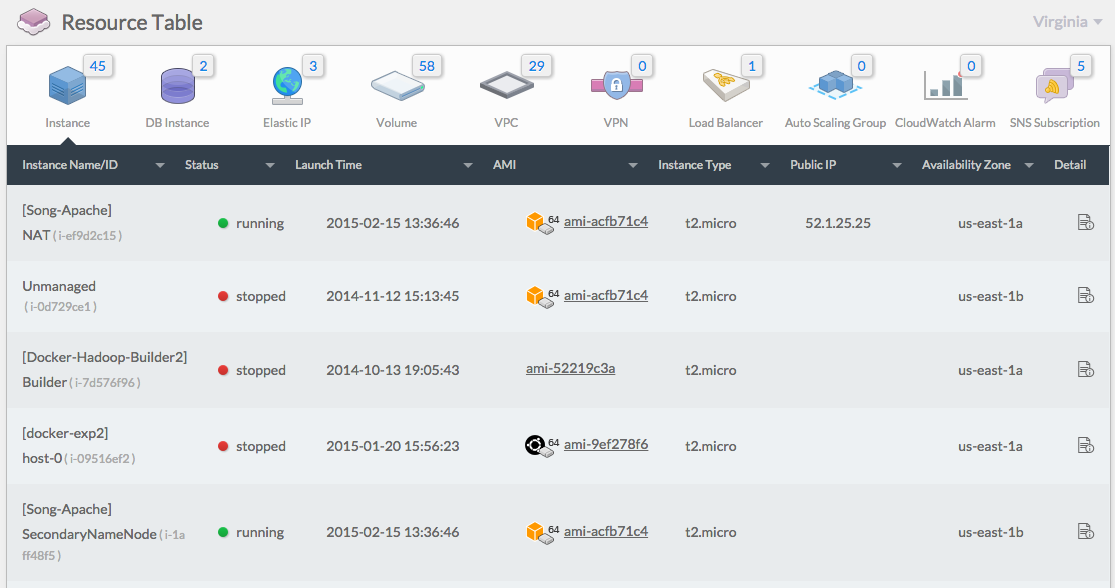
The region specific view is an overview of different resources in a specific region.
You can see here the details of the most relevant AWS resources, whether or not created with VisualOps IDE
Resource Details
You can get more details about a specific resource by clicking on the 'Detail' icon, on the right of each resource. This will display all required information about the resource
For example, for an instance:
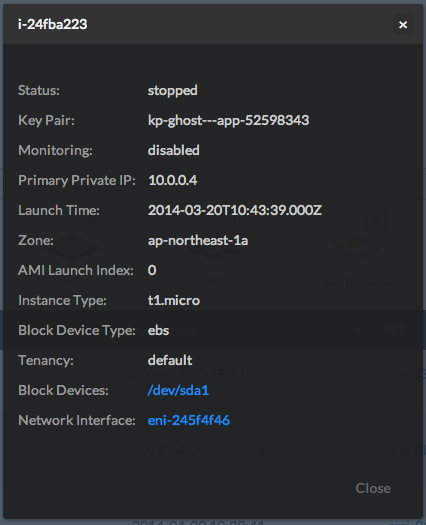
Activity/Audit Log
You can review the recent activities in current workspace.
